Been trialling this new plugin which is really useful, but it does seem to be causing some saving issues on resources. The saving is looping and just hanging. The changes are saved if you refresh the page but not ideal.
If I disable the plugin saving works as expected.
This is on MODX 3.0.2 and 3.1.2 with PHP 8.3.
I really love the idea of having AI to assist so would be good to get this resolved.
I haven’t had the pleasure to play with it, yet.
But I can try to assist you with debugging/hunting the issue.
Normally when such issues happen, you get some information in the developer-tools.
Go edit a page in your setup. Before you press save, open the dev-tools (F12, or CTRL+SHIFT+I). Now press save.
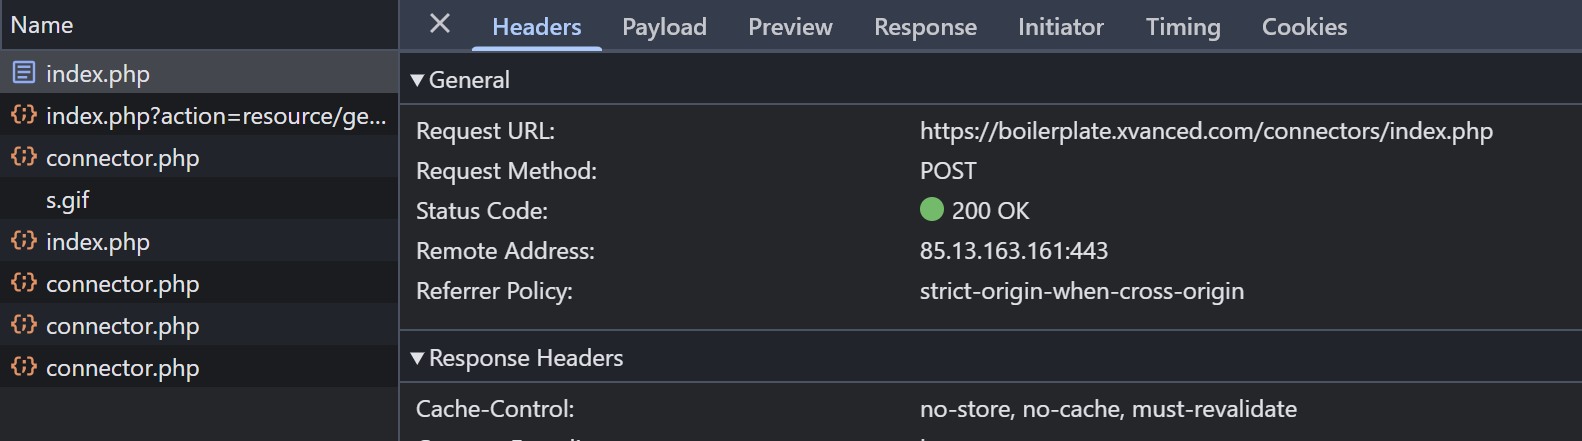
You either can see a Javascript-Error in the tab “Console”, or you see a red line request in the network-tab. If there is a red request, click on it (a side panel opens), and now press on the sub-tab “answer” (or response), and copy the body of the response.
I’ve done as suggested and these are the errors I have received:
typRequest URL:
https://www.website.com/connectors/index.php
Request Method:
POST
Status Code:
500 Internal Server Error
Remote Address:
213.129.84.97:443
Referrer Policy:
strict-origin-when-cross-origine or paste code here
And also:
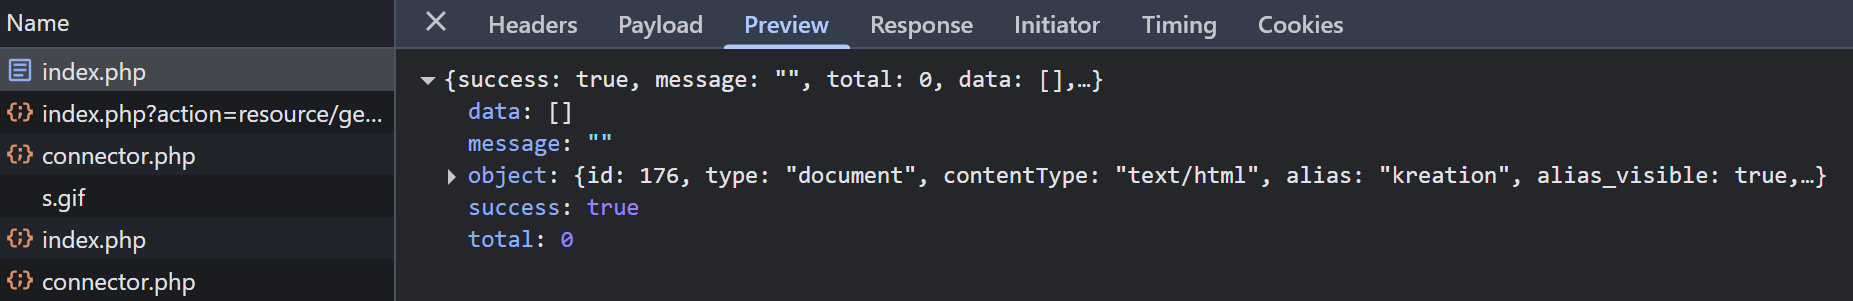
{message: 'JsonReader.read: Json object not found'}
message
:
"JsonReader.read: Json object not found"
[[Prototype]]
:
Object
read	@	ext-all.js:21
handleResponse	@	utilities.js?mv=312pl:409
processResponse	@	ext-all.js:21
success	@	ext-all.js:21
n	@	ext-all.js:21
t	@	ext-all.js:21
A	@	ext-all.js:21
It could be a conflict with another plugin / extra too. Does the above help?
so the first message is from the network-tab, and the second from the console-tab. We are getting closer. And yes, I’m assuming from the beginning, that it has to do with another extra, or something else.
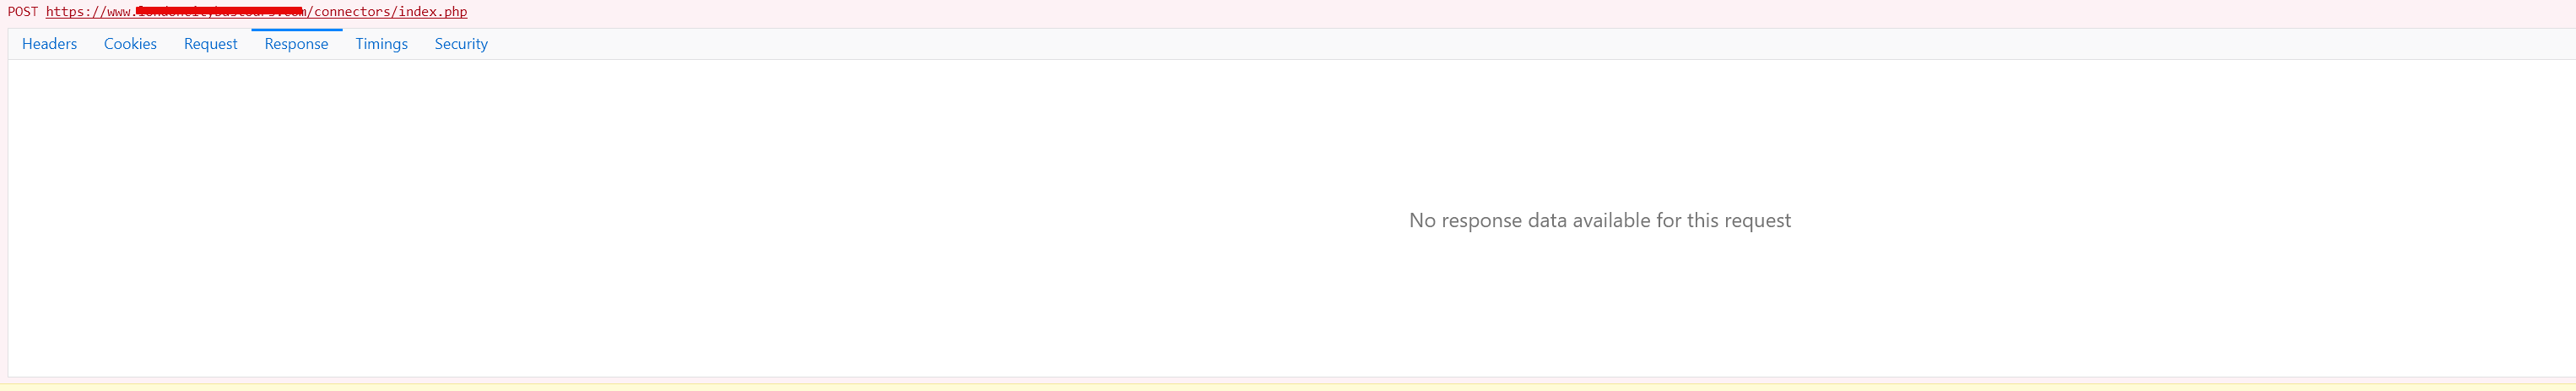
Now do that process again, and then after saving, click on the red request (/connectors/index.php) again. You have shown me the information from the first sub-tab (“Headers”):
Indeed looking at the response there might give us a helpful error message.
The only thing that AIKit currently does on save is index resources into the Pinecone vector database if that’s configured, so I’m guessing it’s going to be tied in with that. Are you using that?
(If you’re not, it’s totally possible that not having it set up causes it to break… this is a very early proof of concept project.)
aikit.vector_database and aikit.pinecone_ system settings would be relevant as well.
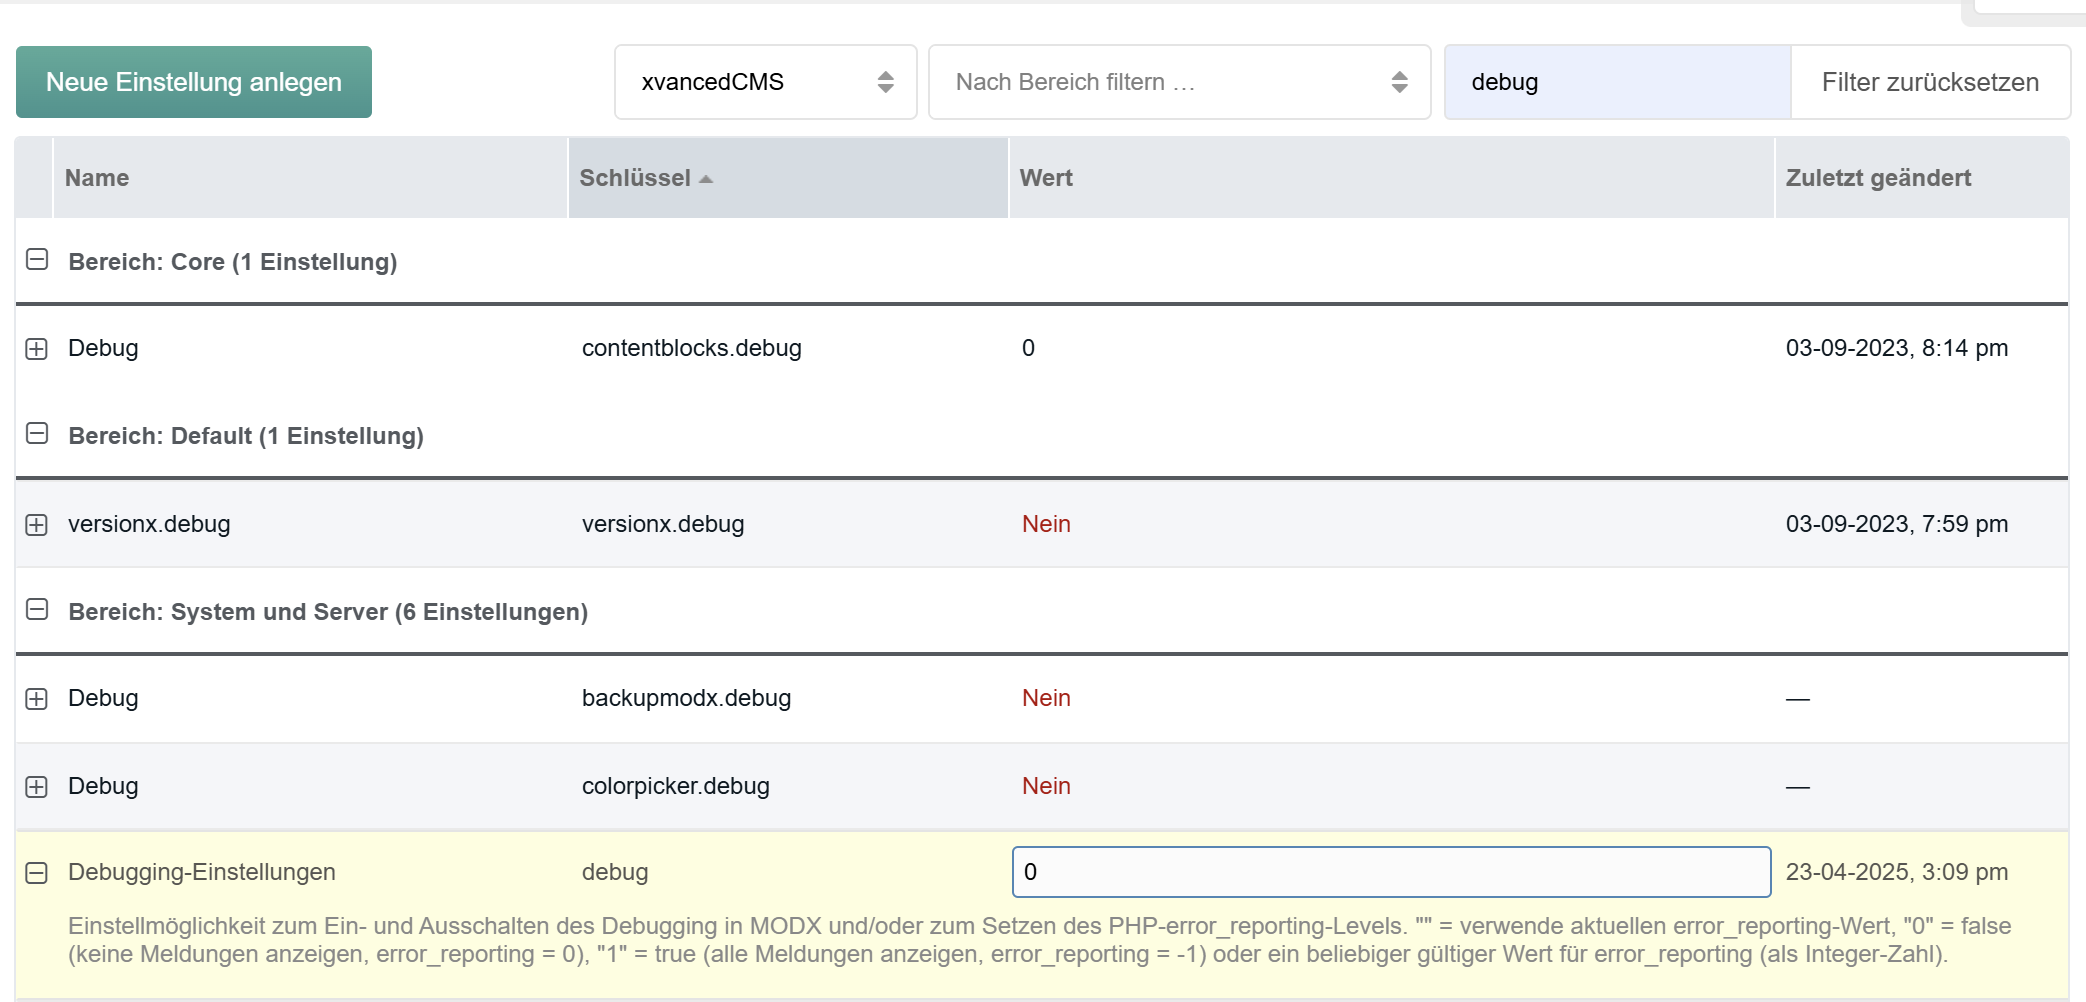
Okay, now I would try to activate the debug-mode, and do the same things again, hoping that the system gives us some more info.
To activate the debug-mode, go to the system-settings, press the “reset filter/search” button (just in case), and then search for “debug” (yellow line in screenshot):
After that, the cache should clear itself. You can do the test-saving again, and hopefully this time, the system tells us where it hurts.
Also, after doing that and checking the response, look into the error-log (located at wwwebsite.com/manager/?a=system/event ), does it have additional errors?
Be aware here, that after activating the debug-mode, the error-log could fill up with a lot of “notices” and/or “warnings” - these are most of the time totally ignorable. We really are just interested in anything in the log that says “ERROR”.
Hmmmmmmmmm, okay - no problem, we’ll find the problem eventually
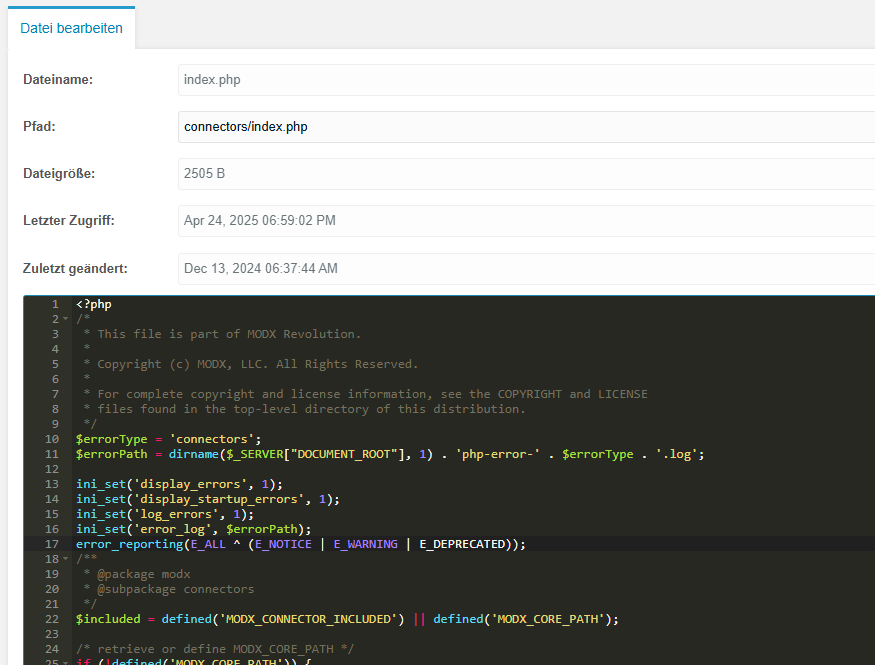
Next I would force the “/connectors/index.php” to display errors. That means, in your preferred way (ssh / ftp), go and edit the file “/connectors/index.php”. At the top, before any other code runs, add the following:
Save the file, and do the saving-test again with checking the request’s response in the developer-tools, and checking MODX’s error-log.
Be aware: If you are testing all that on a production-site, then I’d recommend removing or commenting out the new code you added, and also disabling the debug-mode again, after you finished your save-test.
Side-Notes:
All mentioned steps/tricks can be you used to debug anything in MODX
(actually in any web-application)
If you would have problems in the frontend, and don’t know and don’t see what is causing it, you could add that ^ code (while debug is active) also to your “/index.php” (in your root), to enable showing errors
Or if you have problems in the manager, you could at that ^ code to “/manager/index.php”, to see what is going wrong in the manager
In both last cases, you should change the variable “$errorType” to what you are logging, e. g. ‘frontend’ or ‘manager’
With that ^ code you are also logging errors to a file in your document-root, which will be called php-error-connectors.log
Again, after you finished debugging/fixing, always remove or disable that code by commenting it out